How to Predict Stock Market Crashes: Unveiling the Signs
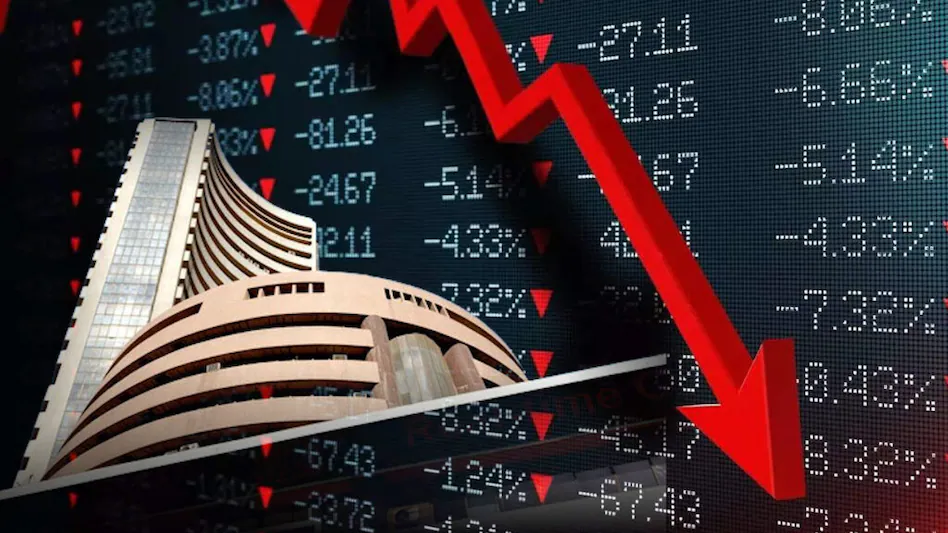
You sense it—the market’s heartbeat racing. But how to predict stock market crash? It’s no psychic trick; it’s about spotting the clear signs. Now, I’m no fortune teller, but I’ve learned to recognize the harbingers of a market downturn. I dig into economic indicators that shout “watch out” and dissect history’s hints at financial doom. Prepare to decode what derivative markets whisper and why yield curves matter. If stocks could talk, they’d tell you I listen—and today, I’m sharing it all with you.
Recognizing the Harbingers of a Market Downturn
Deciphering Economic Indicators of Impending Crashes
Spotting a market crash before it hits is tough but doable. Signs often give us a heads up. Economic indicators are like a puzzle. Fit them together, and you see the full picture. These signs include changes in housing markets, job reports, and consumer spending. When homes don’t sell like they used to, it’s a warning. If fewer people have jobs, less money goes around. And when folks stop buying stuff, the economy feels it.
Historical Analysis: Patterns Preceding Financial Crises
Let’s dive into history. Past crashes from Wall Street to tech bubbles teach us patterns. I look at price charts from back then and spot similarities today. Things like high stock prices with no real profit to back them up. Or when everyone is sure stocks can only go up, that’s risky thinking. It’s like seeing storm clouds and knowing rain’s coming. We also check for too much debt. When companies or people borrow a lot, and rates go up, trouble brews.
In my work, predicting a crash boils down to watchful eyes on these clues. Understanding historical patterns and current signs helps us guess what’s next. Remember, it’s like weather forecasting – not perfect but useful. So we look, learn, and make our best call. This keeps your money safer when the market’s rough waters hit.
Behavioral Finance Signals and Technical Forewarnings
The Role of Investor Psychology in Market Shifts
Markets move not just on facts, but feelings, too. Hope, fear, and greed drive prices. Keep a close eye on how buyers and sellers act on news. People often follow the herd. But herds can run off cliffs in a panic. When folks sell in fear, crashes can follow.
We can spot crash hints in how groups think. Watch for when everyone seems sure stocks will rise. That’s often when they fall. Risk tip: when regular people chat about hot stock tips, beware. Big risks may lurk.
Advanced Technical Analysis Techniques for Crash Prediction
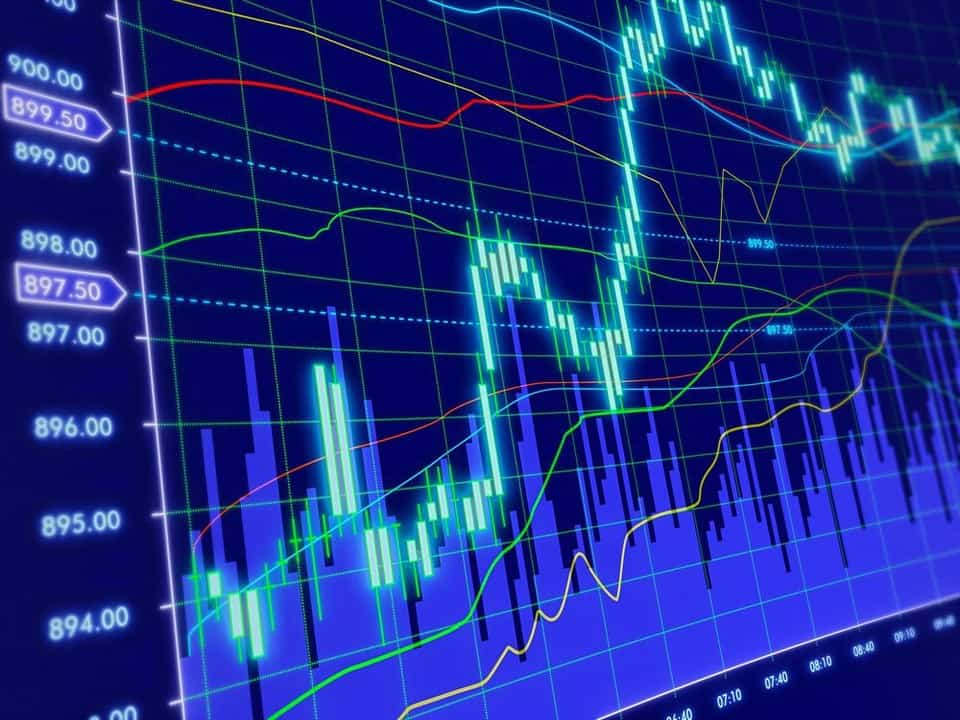
To guess stock drops, look at graphs and trends. This is called technical analysis. It’s like weather forecasting for finance. Some lines on charts tell us to watch out. Like when stocks rock up and down a lot. It hints that a big change may come – often a drop.
Then there are patterns. A head-and-shoulders form warns a fall may follow. We also see bubbles when prices fly too high, too quick. Over time, we learn these signs well. They help to warn us before a fall.
What works best? Mix what charts say with what people feel. Use both facts and feelings to see if markets might crash. This combo can help you stay ahead. Stay sharp and trust but check what charts and people tell you. It’s your safety net in choppy times.
Seek signs like heavy debt, high prices, and wild mood swings. A cool head finds these clues best. And don’t just look at stocks. See credit, homes, and more. All markets are in this together. They talk to each other. If bonds cry, stocks might soon sob. Be a market detective and sniff out trouble before it shows its teeth.
Note well: no one knows the future for sure. But hints help, like a weather vane. Study patterns, keep calm, and watch the herd. That’s how you spy an incoming storm on Wall Street.
Quantitative Measures and the Danger Zone
Interpreting the Message from Derivative Markets
Have you ever wondered about warning signs that a stock market crash is coming? Well, derivative markets can provide some clues. Here’s how: when investors get nervous, they buy options to protect their stocks. This drives up the price of these options. It’s much like people buying more insurance when they sense danger. Big price jumps in options can warn us of a market drop.
Derivative markets are like the canary in the coal mine for us. They signal panic or fear among investors. When fear rises, so does market risk. We watch this market closely, as it can tell us if investors are getting ready for a tumble. If there’s chaos in derivatives, brace yourself; a crash might be on the way.
This isn’t just guesswork. We learn a lot from history. Looking back at past crashes, high option prices often came right before a fall. This pattern is a red flag. It tells us investors are scared and are acting to protect themselves.
The Significance of Yield Curve Inversions
Now let’s chat about yield curve inversions and why they matter. Picture a graph that lines up interest rates by how long you lend your money. Generally, you expect more money back the longer you lend. But sometimes, this flips. When short-term rates leap over long-term rates, we call this an inversion. It’s like getting more for a short job than a long one – it doesn’t make sense, does it?
A flip like this warns us of bad times ahead. An inversion has come before every major crash in the past 50 years. So yes, it’s a big deal. It shows investors think the future looks rough. They’re betting it’ll be safer to hold onto their money rather than to loan it out.
For those trying to avoid losses during downturns, this indicator is gold. Hedge funds and savvy investors watch this inversion closely. If we spot it, it’s time to think about how to protect our investments. We might look at safer places to put our money, like gold or government bonds.
But it’s not just about flipping a switch when the yield curve inverts. We pair this sign with other factors like high stock prices, or frothy valuations. When many warning signals flash together, the risk of a crash climbs.
Keep in mind, not all warnings lead to crashes, and not all crashes announce themselves. But as experts analyzing every blip and bump in the markets, these measures help us stay on our toes. We keep our eyes peeled on the yield curves and option prices, ready to assess and act if stock market skies turn stormy.
In short, the key is to look for patterns in the chaos of the markets—a task we approach with the energy of detectives seeking clues in the dark. It’s a mix of art and science, and no one has a crystal ball. But understanding these signs brings us closer to predicting when the market might just take a nosedive.
From Global Events to Trading Floors: Interconnected Catalysts
Geopolitical Risks and Their Impact on Market Stability
Geopolitical risks can shake the stock market. Think wars, elections, or trade fights. These can scare investors. When investors get scared, they often sell. This sell-off can lead to a market crash. We’ve seen it time and again. To predict possible crashes, watch global events closely. Tension between countries could mean trouble for markets. It’s like a domino effect. One event can push and down goes the market. You want to be ready. So, keep an eye on the news. Look for signs of unrest or conflict. These could be your warning signs of a market downturn.
How Algorithmic Trading Influences Market Volatility
Now let’s talk about algorithmic trading. These are computer programs that trade stocks fast. Super fast! They scan the market, look at numbers, and make trades in seconds. This can cause big swings in stock prices. If the computers start selling, the market can drop hard and fast. This kind of trade looks at stock valuations and patterns. It doesn’t care about human feelings. If the numbers say “sell,” that’s what happens. And if lots of these programs sell at once, it can lead to big trouble. That’s why watching these patterns is key in predicting financial collapse. It’s quite the puzzle. But if investors know how these computers work, they can be one step ahead.
Remember, markets are like a busy city street. Everything’s connected. A big event in one place can send ripples all over. And computer trades can speed things up or slow things down real fast. Keep these in mind, and you can see the signs before a crash happens. It’s all about spotting the links between events and trades. It starts with a deep dive into geopolitics and algorithms. It might sound tough, but once you start, it gets easier to spot those early crash signals. Stay vigilant, stay informed, and you’ll stand a better chance of seeing the warning lights before they flash red.
We’ve covered a lot about market downturns and how to spot them. We looked at economic signs that warn of a crash and dug into past patterns. We also talked about how people’s feelings play a part in market changes, and we checked out some smart ways to guess when a crash might come.
Next, we learned that numbers and data can tell us when markets might tumble. Did you catch the part about what derivative markets hint and why yield curves flipping is a big deal?
And we didn’t forget how big world events and computer trading can shake things up, making markets jump or fall.
So, there you have it — a toolbox full of ways to see a market downturn before it hits. Keep these in mind, and you’ll be one step ahead. Remember, it’s all about being smart with your cash and not getting caught off guard when things take a dip. Stay alert and watch for these signs. That’s the key to playing it safe and coming out on top.
Q&A :
How can I identify signs of a potential stock market crash?
To predict a stock market crash, investors often look for certain warning signs such as extreme valuations, investor euphoria, rapid interest rate hikes, economic downturn indicators, or geopolitical risks. Monitoring market trends and economic data can provide insight into market stability.
What indicators are most reliable for forecasting a stock market downturn?
There are several key indicators that are considered reliable for forecasting market downturns. These include an inverted yield curve, high price-to-earnings ratios, significant drops in consumer confidence, and declining business profits. Analysts may also scrutinize the performance of leading stocks and sectors for signs of weakness.
How does technical analysis help in predicting stock market crashes?
Technical analysis involves examining charts of past market data to identify patterns and trends that can offer clues about future market movements. Traders use various indicators such as moving averages, Relative Strength Index (RSI), and Bollinger Bands to gauge the market’s momentum and volatility, which can help in predicting a potential crash.
Is it possible to accurately predict a stock market crash?
While it is difficult to predict a stock market crash with complete accuracy, investors and analysts use various economic indicators and models to estimate the likelihood of a downturn. No prediction method is infallible, and unexpected events can always precipitate a market crash. Diversification and risk management are key strategies to mitigate the impact of crashes.
Can historical data be used to predict future stock market crashes?
Historical data can be a valuable tool in recognizing patterns that precede market crashes. Analysts often study past crashes to understand the conditions and triggers that led to rapid sell-offs. However, it is important to note that history does not repeat itself exactly, and future crashes may occur under different circumstances.


