Economic Indicators Unveiled: Steering the Stock Market’s Course
How do economic indicators affect the stock market? It’s like a game where every stat counts. Think of the economy as a giant machine. It’s made up of parts like jobs, prices, and how much stuff we’re all making. These parts send signals. They’re like trail markers—they tell us where the stock market might head. If we get it right, we can make smart moves and even see gains in our stocks. So, let’s dive in and get the real scoop. We’ll look at GDP, jobs data, interest rates, and even how folks feel about spending. Get ready to uncover the secrets behind the numbers that move the markets!
Understanding the GDP and Its Impact on the Stock Market
Correlating GDP Fluctuations with Market Trends
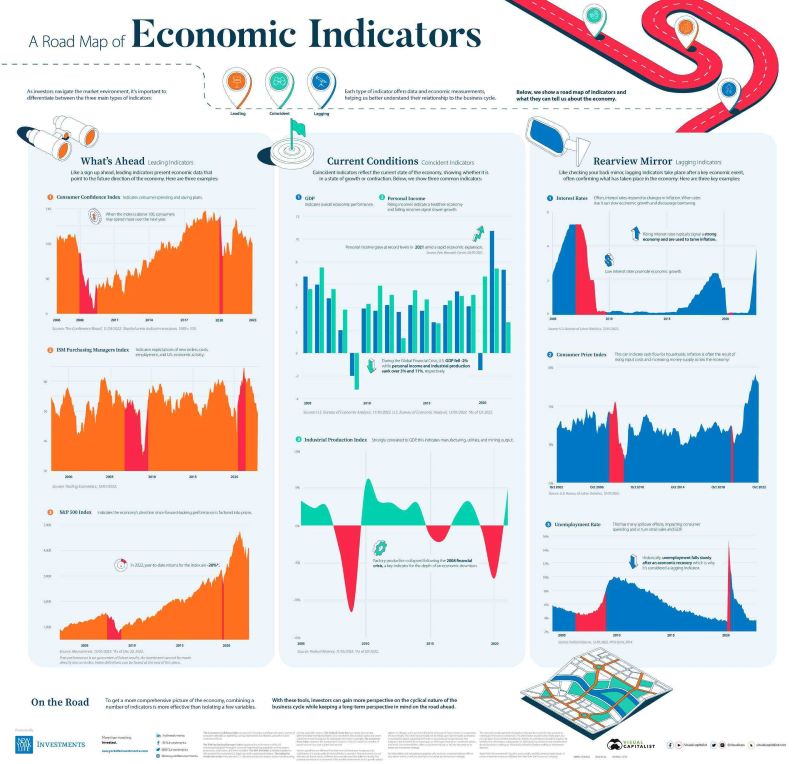
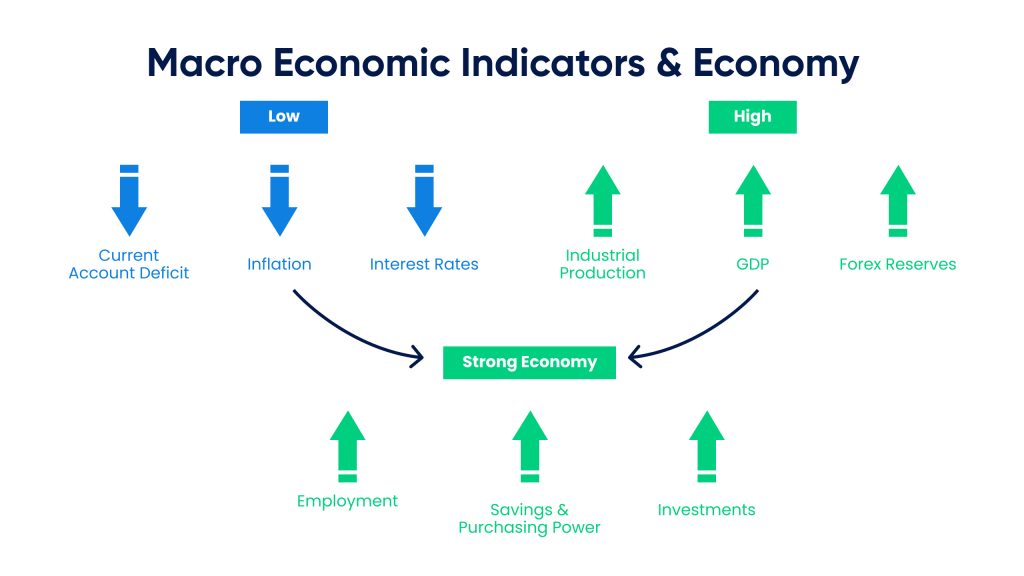
Think of the economy as a big machine and GDP as its scorecard. GDP stands for Gross Domestic Product. It’s the total value of everything a country makes and provides. Now, let’s connect the dots to the stock market. When GDP grows, companies usually make more money. That’s good news for stocks. Investors love seeing those GDP numbers go up because it often means more profits are coming. Strong GDP growth can kick stock prices higher.
But there’s a flip side. If GDP trips and falls, it can drag stocks down with it. Businesses might sell less, and their costs might go up. This can make investors nervous. They might sell their stocks, expecting tough times ahead. And just like that, stock prices can drop.
GDP Announcements and Investor Sentiment
Every time a new GDP report comes out, it’s a big deal for the stock market. Investors wait for it like kids wait for their birthday presents. If the number hits big, you can almost hear the cheers from Wall Street. This excitement from investors can shoot stock prices up faster than a rocket.
What if GDP disappoints? Investors might get scared. They may think, “Uh oh, the economy’s not doing so hot.” Their worries can spread like wildfire. Before you know it, stock prices might stumble like a clumsy runner in a race.
So, here’s the scoop: GDP is a big clue about how our economy’s doing. It can make investors feel confident or worried. And that feeling? It’s powerful. It can make the stock market soar or sink.
Economic reports show us how the wind’s blowing in the economy’s sails. When we hear that GDP is doing great, we might think companies will do great too. This can lead to more money flowing into stock markets. When GDP’s down, it can make us think twice about our stocks.
One thing’s sure: GDP and the stock market go hand in hand, like peanut butter and jelly. It can be a smooth ride up with rising GDP, or a slide down when it shrinks. We keep an eye on GDP because it helps us guess where the stock market might head next. And guessing right can mean the difference between making and losing money in stocks.
Remember, the stock market’s always paying attention to GDP. So, when the next GDP report lands, watch out. It might just steer the stock market’s course like a captain at the helm of a ship.
Unemployment Data and Its Significance for Investors
Stock Market Reaction to Unemployment Reports
When folks lose jobs, it makes news. It’s clear why, too. Job numbers tell us plenty about our economy’s health. They can even give clues about where stocks might head. Imagine getting a peek into a crystal ball, but for your investments. Unemployment data offers that glimpse.
Each month, we see new reports on jobs. They show us who’s out of work and looking. If lots are jobless, it can scare folks in the stock market. They might think companies aren’t doing well and sell their stocks. This can make stock prices fall. But if fewer people are out of work, that’s good news. It suggests businesses are booming, and folks want to buy more stocks, pushing prices up.
How Jobless Claims Influence Market Predictions
Now, think about jobless claims. That’s a count of new folks asking for unemployment help. These claims give a weekly snapshot of the job market. They’re fresh and fast, like instant photos of the economy.
If claims go up, that’s often a bad sign for the stock market. Investors might worry and think twice before buying stocks. Stocks can dip as a result. But if claims drop, and it keeps happening, that’s a good sign. It means not many folks are losing jobs, the economy might be sturdy, and stocks could climb.
Remember, jobless stats are just one part of a big picture. They hang out with other clues like how much we make and spend, or how many things factories make. All these clues together help smart investors guess what might happen next in the stock market. So, when you hear about jobless numbers, think about what they mean for businesses and your own pocket. It’s a bit like being a detective, looking for hints that show what might happen soon with stocks.
Interest Rates and Inflation: A Dual Force Shaping Equities
The Role of Central Bank Interest Rate Decisions in Equity Valuation
When we talk about stocks, we often hear about interest rates. They are super important. The folks at the central bank decide what these rates should be. Think of interest rates like a lever that can make stocks go up or down. When the central bank changes rates, it’s a big deal for everyone. If rates go up, it costs more to borrow money. This can slow down spending and hurt profits. Stocks may then fall because folks are wary. But if the central bank lowers interest rates, it can do the opposite. It’s cheaper to get loans, so people spend more and businesses grow. Stocks can then rise as investors see more profit ahead.
Interpreting Inflation Metrics for Market Performance Insights
Now let’s talk about inflation. It’s when prices rise over time and your money buys less. No one likes to pay more for stuff they need, right? But for investors, understanding inflation is key. When we look at inflation figures, we can guess how stocks will do. If inflation is low and stable, that’s good for stocks. It helps businesses plan and keeps costs cool. When prices don’t jump too high, investors feel happy.
But if inflation is high, it can scare the market. People worry that money will lose its value fast. So, they might not want to invest in stocks. Instead, they look for other places to keep their money safe. That’s when you see stocks drop. It’s all about confidence. If folks think prices will stay okay, they’re more likely to invest in stocks. This can help the stock market do well. It’s a tricky dance, but once you get it, you can see how it all connects.
Consumer Confidence and Federal Reserve Communications as Market Catalysts
Analyzing the Consumer Confidence Index and its Stock Market Impact
Guess what? When folks feel good about the economy, they spend more. This matters to companies. Why? Because when people buy stuff, companies make money, and their stocks can go up. This is where the Consumer Confidence Index, or CCI, comes into play. It measures how people feel about the economy.
So, what does the CCI do? It tells us if people are willing to open their wallets. A high CCI score means folks are feeling positive and might spend money. This can be good for the stock market because it could mean more sales for companies.
And when we check the CCI and stocks, we often find they move together. If the CCI jumps up, the stock market might go up too. But if it drops, that could be a sign people are not spending. That might make stocks fall.
Assessing the Effects of Federal Reserve Announcements on Investor Decisions
Now, let’s talk about the big bank that takes care of our country’s money. It’s called the Federal Reserve, or Fed for short. The Fed makes big decisions that can change how the stock market moves, like changing interest rates.
You might wonder, why does what the Fed says matter so much? Their words can shake up investor choices. Think of it like this. Let’s say the Fed cuts interest rates. That makes it cheaper to borrow money. Companies can borrow for less and grow more. This can make their stocks more appealing.
But if the Fed raises rates, it’s the opposite. It costs more to borrow. That can slow down company growth and turn people away from stocks. So, each and every word the Fed says is super important for the stock market.
To sum it up, when the CCI is high, stocks could climb. And what the Fed says can make stocks swing up or down. Knowing these can help anyone understand why the stock market moves the way it does. This is key for anyone keeping an eye on their investments.
In this post, we dove deep into economic signals like GDP, job data, rates, and more. We saw how GDP shifts can sway markets and shape how we invest. Rising or falling GDP can signal market trends, stirring investor sentiment along the way. Jobs data, too, are key. Reports show us economic health, guiding predictions about where stocks might go.
We also hit on interest rates and inflation, two big players. Central banks juggle rates to steer economies, affecting stocks in the process. Inflation rates also give us clues about market moves. Together, they form a powerful pair that can rock the investment world.
Finally, we talked about consumer mood and Fed news. Both can push the market up or down in a flash. That’s why keeping an eye on them is crucial for investing right.
In a nutshell, all these points are big deals for your money. They’re the pulse of the market, the signs that guide smart investment choices. Use them to stay sharp and invest wisely.
Q&A :
How do economic indicators impact stock market trends?
Economic indicators are key statistics that signal the current state of the economy and can profoundly influence stock market performance. When indicators suggest economic growth, stocks tend to rise due to expectations of higher profits and strong business performance. Conversely, indicators pointing to economic downturns often result in stock market declines, as investors anticipate lower earnings and increased risk.
What are the most influential economic indicators for stock market investors?
Several key economic indicators hold significant sway over stock market movements. These include Gross Domestic Product (GDP), unemployment rates, inflation data (Consumer Price Index), interest rates set by central banks, and manufacturing data (Purchasing Managers’ Index). Investors closely watch these metrics to predict market trends and make informed investment decisions.
Can leading economic indicators predict future stock market behavior?
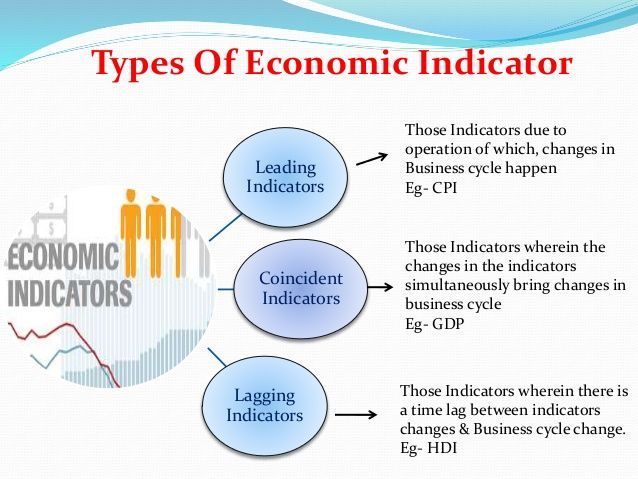
Leading economic indicators, such as stock futures, housing permits, and the Index of Consumer Sentiment, are designed to predict the future direction of the economy. While they offer insights into possible trends, predicting stock market behavior is complex due to numerous influencing factors. As such, leading indicators are part of a broader analysis and not foolproof predictors.
How does inflation affect stock market performance?
Inflation can have a mixed impact on stock markets. Moderate inflation is often a sign of a growing economy, which can be beneficial for stocks. However, high inflation can erode purchasing power and squeeze corporate profits, leading to potential declines in stock prices. Central bank policies to control inflation, such as raising interest rates, can also affect investor sentiment and market performance.
Why do investors monitor interest rates as economic indicators?
Interest rates are a crucial economic indicator for stock market investors because they affect the cost of borrowing, consumer spending, and overall economic growth. When central banks lower interest rates, it encourages spending and investing, which can boost stock markets. Conversely, higher interest rates can slow down borrowing and spending, which might lead to a market downturn.


